 |
| English: Real Signiorage vs. Inflation Rate (Laffer Curve) (Photo credit: Wikipedia) |
 |
| English: The Laffer curve Svenska: Lafferkurvan (Photo credit: Wikipedia) |
 |
| English: Real Signiorage vs. Inflation Rate (Laffer Curve) (Photo credit: Wikipedia) |
 |
| Dansk: Laffer kurve (Photo credit: Wikipedia) |
 |
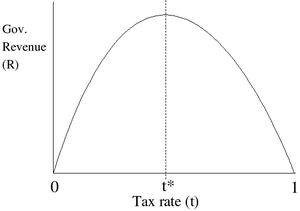
| Deutsch: Laffer-Kurve. Der Scheitelpunkt der Parabel ist rein hypothetisch. (Photo credit: Wikipedia) |
 |
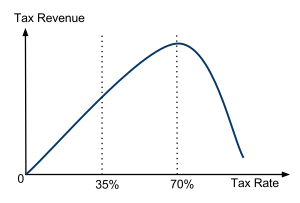
| English: A non-symmetric Laffer Curve with a maximum revenue point at around a 70% tax rate. This graph is based on the results from "How Far Are We From The Slippery Slope? The Laffer Curve Revisited" by Mathias Trabandt and Harald Uhlig, NBER Working Paper No. 15343, September 2009. Specifically, it mimics the curve found in Figure 2 of that paper. Their research estimated Laffer Curve maximum revenue points to be between 60% to 80% tax rates. (Photo credit: Wikipedia) |
 |
| US Tax Rates (Taxes on riches/wealth) (Photo credit: mSeattle) |
Articles: Why the Left Hates the Laffer Curve:
"There is no single "Laffer Curve"; there is no set-in-stone point at which increased
tax rates cease to generate government returns. But we can be reasonably certain that during the last century we in
America have at different times found ourselves on both sides of the curve. There have been occasions where increased tax rates clearly resulted in increased
government revenue. There have been occasions where decreased tax rates clearly resulted in increased government revenue. When it comes to the argument of whether tax rates should be raised or lowered, at different points in time and in different economic circumstances, each side of the political aisle has been correct. At different points in time and in different economic circumstances, each side has been wrong."


U7Hw~~60_57.JPG)


